
Property Market Review – December 2019
TAKE-UP OF WAREHOUSE SPACE SURGES TOWARDS END OF 2019According to Savills, a wide range of occupiers are causing a surge in demand for industrial warehouse space (units of 100,000 sq. ft. plus), with take-up due to hit a total of 33 million sq. ft. by the end of this year. In particular, take-up by third-party logistics (3PL) providers has hit a record high, climbing to 8.3 million sq. ft. by Q3. This has led to speculation that 3PLs are taking advantage of ongoing political uncertainty and capitalising on retailers’ desire to stockpile goods within the UK prior to Brexit. Savills’ data also notes a significant upswing (400% over the last decade) in take-up from food production and grocery suppliers, mainly caused by the huge growth of the online grocery sector with the likes of Ocado and Amazon Fresh. Q3 BOUNCE BACK FOR SCOTTISH COMMERCIAL PROPERTYCommercial property in Scotland enjoyed a strong Q3, with a total of £1.2 billion transacted between July and September 2019, according to the Scottish Property Federation. This was nearly double the total sales value transacted in Q2 and was mostly driven by significant growth in Edinburgh. In fact, the total va lue of commercial property sales in the capital more than tripled to £462 million. Other cities, including Glasgow, also saw significantly increased sales, with interest from foreign investors remaining high – most likely because the sterling slump is making Scotland, and the UK as a whole, a less expensive location for overseas buyers. CROWN ESTATE ADDS TO PORTFOLIO IN CENTRAL LONDONThe Crown Estate, which manages the Queen’s extensive land and property holdings, has purchased the lease interest of 130 Jermyn Street in the St James’s district of central London for £70 million. Although it already owned the freehold, the purchase of the lease means that the Crown Estate now has full control of the building, which measures 56,800 sq. ft. It now plans to find retailers to occupy the space, which, it says, will “enhance the retail and dining mix, benefiting the immediate community as well as attracting visitors to the area.” WEAKER POUND LEADS TO LONDON HOTEL BOOMInvestors took advantage of the weaker pound, a result of the political turmoil caused by Brexit, to make moves in the UK hotels market. Over 200 hotels have either received planning permission or are in construction across the capital, with nearly a quarter (48) of these located in Westminster. While most areas of the British economy are struggling under the weight of political uncertainty, this boom makes the hotel industry one of the few to be benefiting from the longstanding instability brought about by the UK’s imminent exit from the EU. The weaker pound also boosted international tourist numbers, as well as encouraging more Britons to take ‘staycations’ to avoid punitive exchange rates.
|
| Back to top |
|
| Back to top |
HOUSE PRICES PRICE CHANGE BY REGION |
||||||||||||||||||||||||||||||||||||||||||||||||||||||||||||||||||||||||||
|
| Back to top |
|
| Back to top |
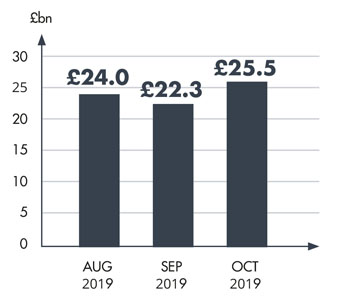
MORTGAGE ACTIVITY |
|
| Back to top |
| It is important to take professional advice before making any decision relating to your personal finances. Information within this document is based on our current understanding and can be subject to change without notice and the accuracy and completeness of the information cannot be guaranteed. It does not provide individual tailored investment advice and is for guidance only. Some rules may vary in different parts of the UK. |